수원 기온 분석
data.kma.go.kr 데이터 활용
- suwon.csv 파일 읽기
import csv
f = open('suwon.csv', 'r', encoding='utf-8')
data = csv.reader(f, delimiter=',')
print(data)
f.close()
<_csv.reader object at 0x7fd2f90bbac0>
f = open('suwon.csv', 'r', encoding='utf-8')
data = csv.reader(f)
for row in data:
    print(row)
f.close()
['\ufeff"\t\t지점번호"', '지점명', '일시', '평균기온(℃)', '최고기온(℃)', '\t최고기온시각', '최저기온(℃)', '최저기온시각일교차', '']
['\t\t119', '수원', '1964/01/01', '-5', '-2.1', '14:48', '-8.1', '24:00:00', '6']
['\t\t119', '수원', '1964/01/02', '-3.7', '0.9', '15:54', '-8.4', '0:31', '9.3']
['\t\t119', '수원', '1964/01/03', '-3.3', '1.4', '15:40', '-8.3', '6:52', '9.7']
['\t\t119', '수원', '1964/01/04', '-5.7', '0.7', '15:11', '-10.7', '8:10', '11.4']
['\t\t119', '수원', '1964/01/05', '-2.7', '2.5', '14:12', '-9.6', '5:26', '12.1']

...

['\t\t119', '수원', '2020/12/27', '4.7', '9.1', '13:05', '-0.1', '1:26', '9.2']
['\t\t119', '수원', '2020/12/28', '5.3', '11.4', '15:27', '1.4', '23:53', '10']
['\t\t119', '수원', '2020/12/29', '-0.3', '4.2', '11:10', '-5.4', '23:59', '9.6']
['\t\t119', '수원', '2020/12/30', '-10', '-5.4', '0:01', '-12.5', '23:34', '7.1']
['\t\t119', '수원', '2020/12/31', '-8.7', '-4.4', '13:50', '-12.6', '5:56', '8.2']
헤더 저장하기
- next( ) 함수를 이용하여 헤더 저장
f = open('suwon.csv')
data = csv.reader(f)
header = next(data)
print(header)
f.close()
['\ufeff"\t\t지점번호"', '지점명', '일시', '평균기온(℃)', '최고기온(℃)', '\t최고기온시각', '최저기온(℃)', '최저기온시각일교차', '']
가장 더웠던 날 찾기
- 기온을 float로 변환
f = open('suwon.csv')
data = csv.reader(f)
header = next(data)
for row in data:
    row[4] = float(row[4])   # 최고기온부분만 변환
    print(row)
f.close
f = open('suwon.csv')
data = csv.reader(f)
header = next(data)
max_temp = -999
max_date = ''
for row in data:
    if row[4] == '':
        row[4] = -999
    row[4] = float(row[4])
    if max_temp < row[4]:
        max_date = row[2]
        max_temp = row[4]
f.close()
print('가장 기온이 높았던 날 : ', max_date, '\n기온 : ', max_temp)
가장 기온이 높았던 날 :  2018/08/01
기온 :  39.3
- 최저기온 찾기
f = open('suwon.csv')
data = csv.reader(f)
header = next(data)
min_temp = 999
min_date = ''
for row in data:
    if row[6] == '':
        row[6] = 999
    row[6] = float(row[6])
    if min_temp > row[6]:
        min_date = row[2]
        min_temp = row[6]
f.close()
print(min_date, min_temp)
1969/02/06 -25.8
생일의 기온변화 그려보기
- 최고기온 출력
f = open('suwon.csv')
data = csv.reader(f)
header = next(data)

for row in data:
    print(row[4])
-2.1
0.9
1.4
0.7
2.5
…
9.1
11.4
4.2
-5.4
-4.4
- 데이터 리스트에 저장
f = open('suwon.csv')
data = csv.reader(f)
header = next(data)
result = []
for row in data:
    if row[4] != '':
        result.append(float(row[4]))
print(result)
[-2.1, 0.9, 1.4, 0.7, 2.5, 4.8, ... , 3.8, 8.5, 9.1, 11.4, 4.2, -5.4, -4.4]
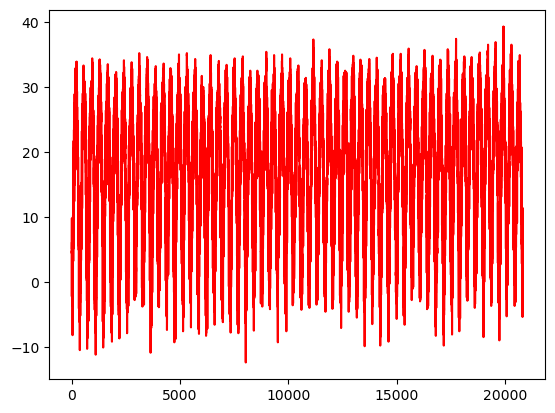
- 최고기온 데이터 그래프로 그려보기
import matplotlib.pyplot as plt
plt.plot(result, 'r')
plt.show()
- 날짜 분리하기
date = '1994-09-30'   # 1994/09/30 이라면 '-' 대신 '/'
print(date.split('-'))

# 연 월 일 추출
print(date.split('-')[0])
print(date.split('-')[1])
print(date.split('-')[2])
['1994', '09', '30']
1994
09
30
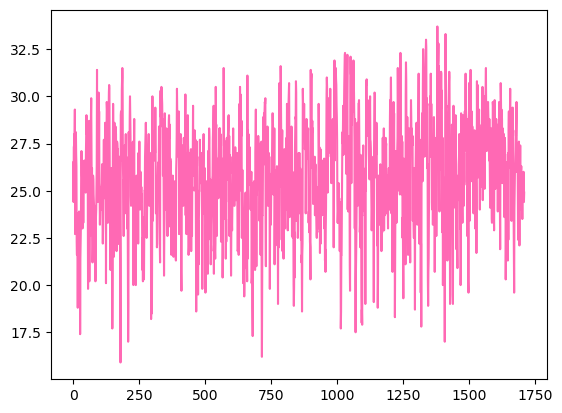
- 9월의 최고기온 데이터 시각화하기
f = open('suwon.csv', 'r', encoding='utf-8')
data = csv.reader(f)
header = next(data)
result = []
for row in data:
    print(row)
['\t\t119', '수원', '1964/01/01', '-5', '-2.1', '14:48', '-8.1', '24:00:00', '6']
['\t\t119', '수원', '1964/01/02', '-3.7', '0.9', '15:54', '-8.4', '0:31', '9.3']
['\t\t119', '수원', '1964/01/03', '-3.3', '1.4', '15:40', '-8.3', '6:52', '9.7']
['\t\t119', '수원', '1964/01/04', '-5.7', '0.7', '15:11', '-10.7', '8:10', '11.4']
['\t\t119', '수원', '1964/01/05', '-2.7', '2.5', '14:12', '-9.6', '5:26', '12.1']
…
['\t\t119', '수원', '2020/12/26', '1.6', '8.5', '14:46', '-2.9', '0:03', '11.4']
['\t\t119', '수원', '2020/12/27', '4.7', '9.1', '13:05', '-0.1', '1:26', '9.2']
['\t\t119', '수원', '2020/12/28', '5.3', '11.4', '15:27', '1.4', '23:53', '10']
['\t\t119', '수원', '2020/12/29', '-0.3', '4.2', '11:10', '-5.4', '23:59', '9.6']
['\t\t119', '수원', '2020/12/30', '-10', '-5.4', '0:01', '-12.5', '23:34', '7.1']
['\t\t119', '수원', '2020/12/31', '-8.7', '-4.4', '13:50', '-12.6', '5:56', '8.2']
print(header)
['\ufeff"\t\t지점번호"', '지점명', '일시', '평균기온(℃)', '최고기온(℃)', '\t최고기온시각', '최저기온(℃)', '최저기온시각일교차', '']
f = open('suwon.csv', 'r', encoding='utf-8')
data = csv.reader(f)
header = next(data)
result = []
for row in data:
    if len(row) == 0:
        continue
    if row[4] != '':   # 9월에 데이터가 비어있지 않았다면
        if row[2].split('/')[1] == '09':   # 9월에 해당하는 데이터라면
            result.append(float(row[4]))

plt.plot(result, 'hotpink')
plt.show()
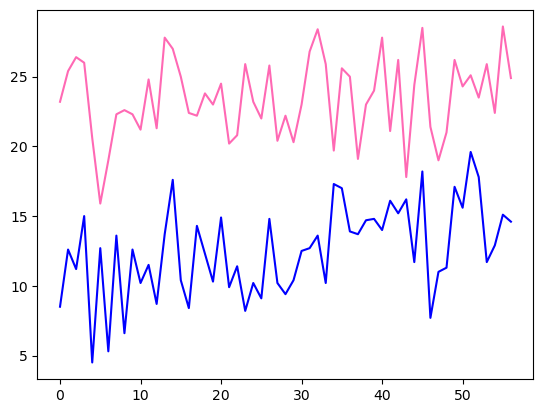
- 생일의 최저기온, 최저기온 데이터 시각화해보기
f = open('suwon.csv', 'r', encoding='utf-8')
data = csv.reader(f)
header = next(data)
result1 = []
result2 = []
for row in data:
    if row[4] != '':
        if row[2].split('/')[1]=='09' and row[2].split('/')[2]=='30':
            result1.append(float(row[4]))
    if row[6] != '':
        if row[2].split('/')[1]=='09' and row[2].split('/')[2]=='30':
            result2.append(float(row[6]))

plt.plot(result1, 'hotpink')
plt.plot(result2, 'blue')
plt.show()
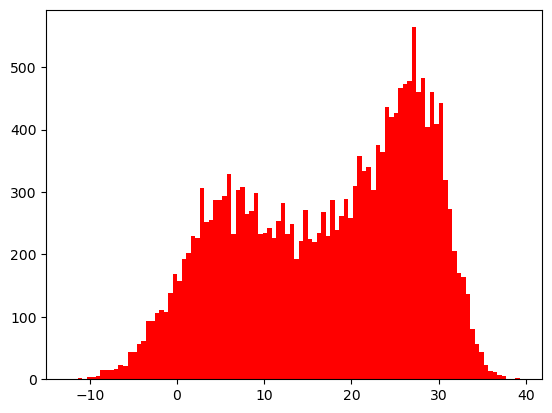
기온 데이터를 히스토그램으로 표션
- 최고 기온 데이터를 히스토그램으로 표션
f = open('suwon.csv', 'r', encoding='utf-8')
data = csv.reader(f)
header = next(data)
result=[]

for row in data:
    if row[4] != '':
        result.append(float(row[4]))

plt.hist(result, bins=100, color='r')
plt.show()
- 9월 최고기온, 최저기온을 히스토그램으로 표현해보기
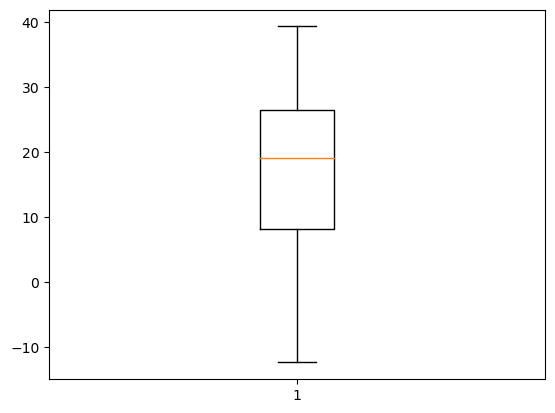
기온 데이터를 상자그림으로 표현하기
- 최고 기온 데이터를 상자그림으로 표현하기
f = open('suwon.csv', 'r', encoding='utf-8')
data = csv.reader(f)
header = next(data)
result=[]

for row in data:
    if row[4] != '':
        result.append(float(row[4]))

plt.boxplot(result)
plt.show()
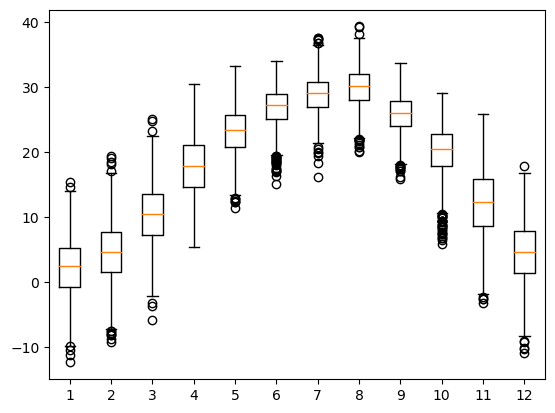
- 1월부터 12월까지 최고 기온 데이터를 상자 그림으로 표현하기
f = open('suwon.csv', 'r', encoding='utf-8')
data = csv.reader(f)
header = next(data)

month=[[],[],[],[],[],[],[],[],[],[],[],[]]

for row in data:
    if row[4] != '':
        month[int(row[2].split('/')[1])-1].append(float(row[4]))

plt.boxplot(month)
plt.show()
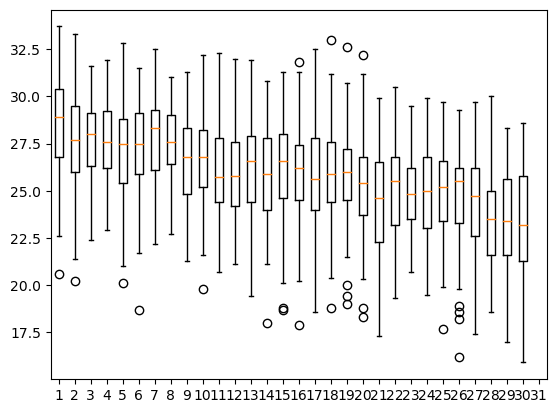
- 9월 1일부터 31일까지 최고기온 데이터 상자그림으로 표현
f = open('suwon.csv', 'r', encoding='utf-8')
data = csv.reader(f)
header = next(data)

day=[[],[],[],[],[],[],[],[],[],[],[],[],[],[],[],[],[],[],[],[],[],[],[],[],[],[],[],[],[],[],[]]

for row in data:
    if row[4] != '':
        if row[2].split('/')[1]=='09':
            day[int(row[2].split('/')[2])-1].append(float(row[4]))

plt.boxplot(day)
plt.show()